
This feature allows you to compare a batch with the average data from batches of the same strain from breeders who belong to your organisation. It is also possible to display the standard curve for the strain, as provided by the breeding companies, on the graphs.
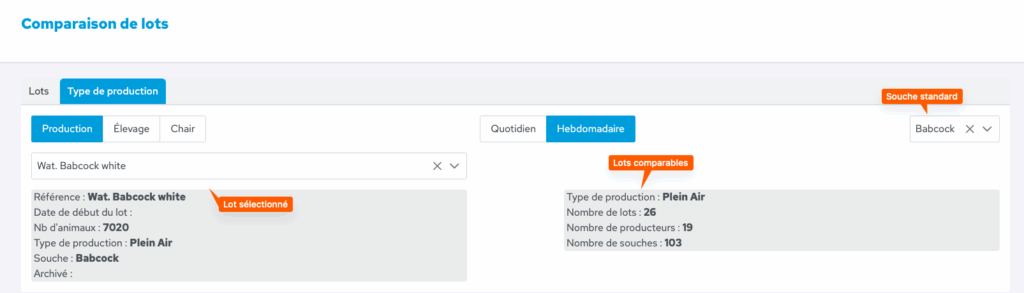
In the vertical menu, click on ‘Analysis’ and then on the ‘Production type’ tab. Choose a production type: production, rearing or meat. Select one of the flocks corresponding to this type.
In the example below, the “Wat. Babcock White” flock will be compared with 26 free-range flocks, from 19 producers and comprising 103 strains. We have chosen to display weekly data (rather than daily) and the standard curve for the Babcock strain.
The parameters compared are the laying rate, the average weight of the birds, the mortality rate, the water-to-feed ratio, the amount of feed distributed per bird, the average weight of the eggs, the percentage of rejected eggs, and the feed conversion ratio per egg. The application provides a graph for each of these criteria.