Managing flocks

Managing your flocks in Aniprev

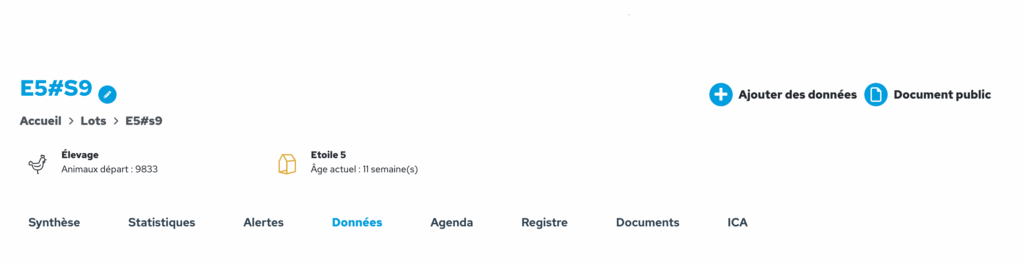
To add data for a flock, select that flock from the left-hand menu, then click the ‘+’ in the top right-hand corner to add data. You can enter data in standard mode or in notebook mode.

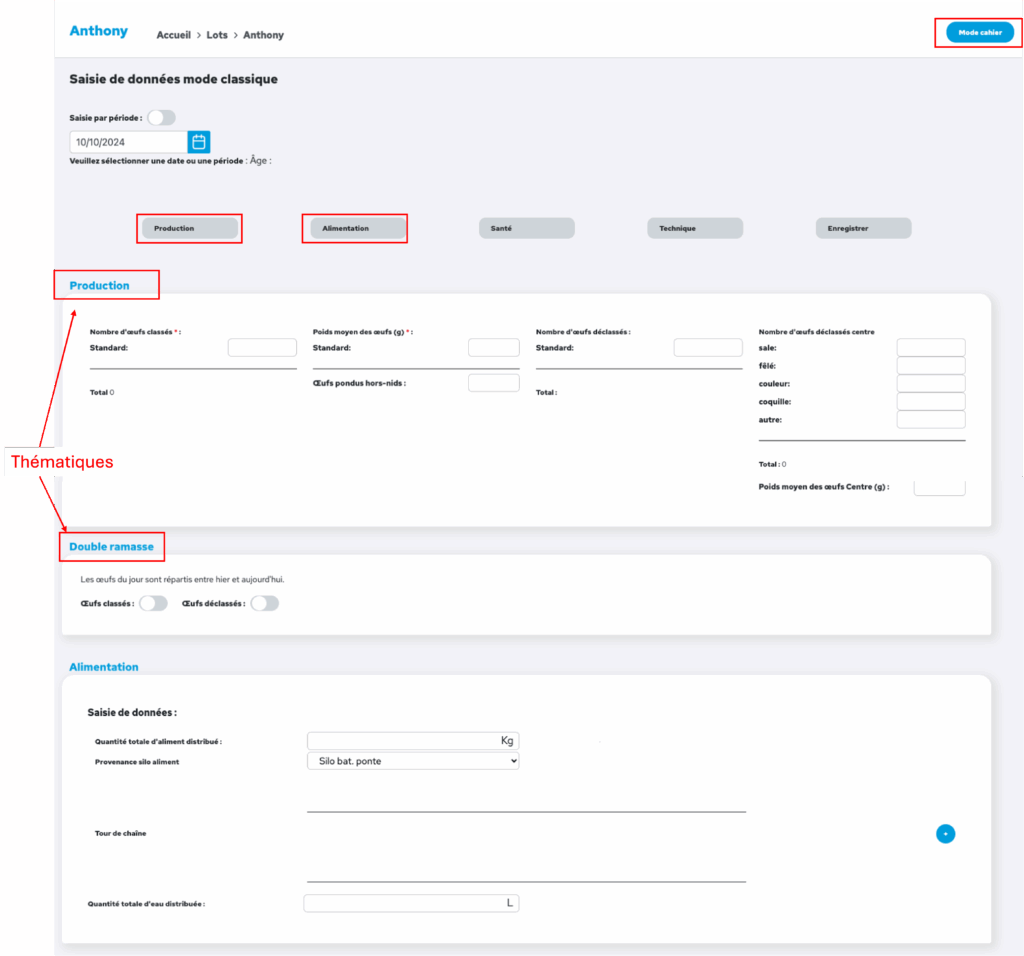
Classic mode offers a more comprehensive and detailed form, with a clear layout. It allows you to enter data by following a guide provided by Aniprev, topic by topic. Shortcuts at the top of the page allow you to access the various topics directly. You must first specify whether you are entering data for a specific date or for a given period.
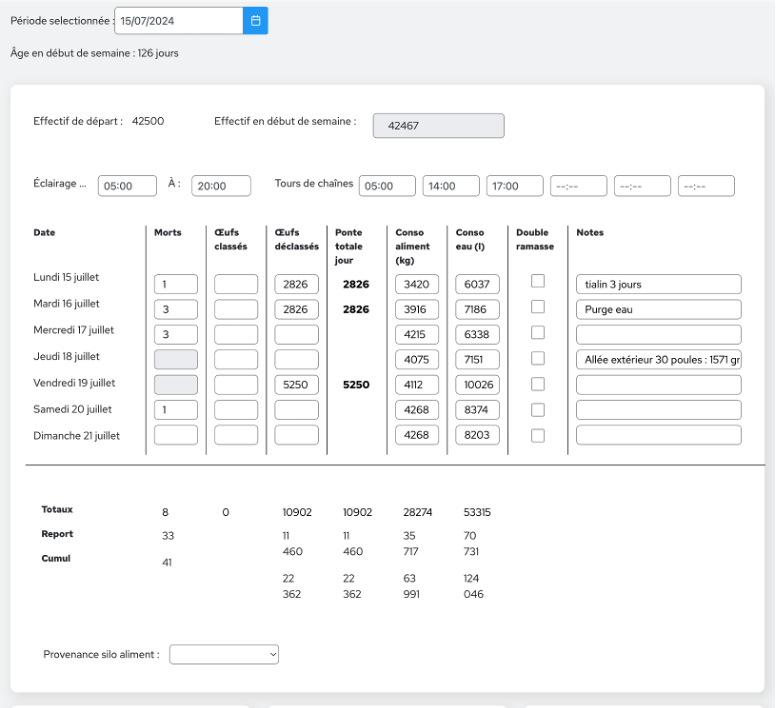
Notebook mode, which can be accessed by clicking the ‘Notebook mode’ button in the top right-hand corner of the data entry screen, replicates the breeding logbook familiar to breeders. More concise, it contains fewer fields than classic mode and presents them in a weekly table for a clear overview that fits on a single screen. It allows you to enter data on a daily and/or weekly basis. You can switch back to classic mode by clicking on ‘classic mode’ in the top right-hand corner of the page.
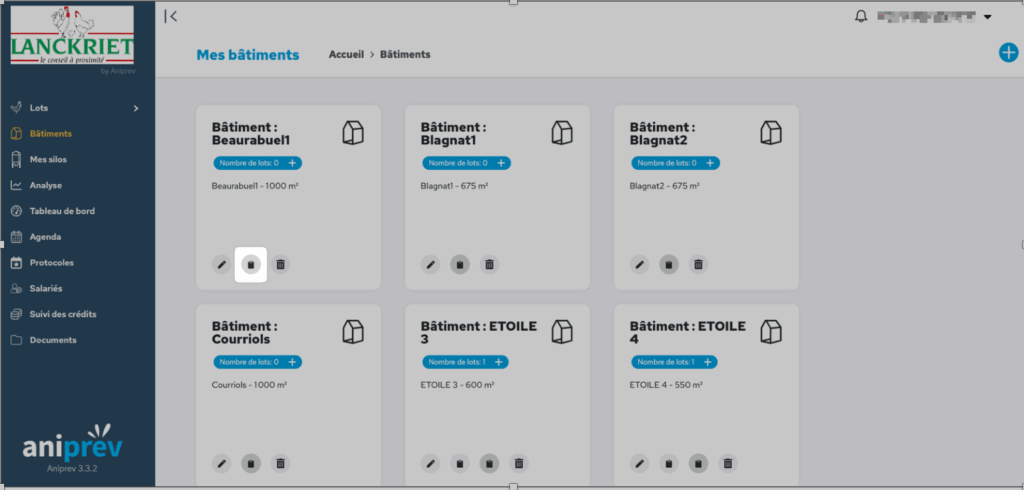
Entering data by building allows you to enter data for several flocks at once. The data is then distributed amongst the lots located in that building. Please note that data entered in this way will overwrite any existing data for the same period.

To enter data by building, click on ‘Buildings’ in the left-hand menu, then click on the ‘Add data’ icon for the relevant building.

Specific fields:

  • Entry by period: tick this box to record data for a period rather than a specific day.
  • Shift: By clicking on the ‘+’ icon on the right, you can enter the times of the shifts.

You can add a note with free-form text whilst entering data. This note will then appear in the diary on the relevant date.

You can also create notes directly from the diary menu.

You can add photos or videos from the flock calendar.

Select the herd you wish to view from the vertical menu on the left-hand side of the page. On the herd’s home page, the overview displays some key figures about the herd (age of animals, mortality rate, feed intake, average weight, etc.) and a summary of the most recent data entry.

In the horizontal menu for the flock, click on ‘Data’ to view all the data entered for that batch in table form. You can view it by day or by week. You can customise the display by selecting the columns you wish to see, and save your preferences.

There is a filter to show days on which no data has been entered, or, conversely, to hide them.

The customised table can be exported to Excel format.

In the horizontal menu for the flcok, click on ‘Statistics’ to view the graphs for that batch. The following graphs are available:

  • Amount of feed distributed per animal
  • Water-to-feed ratio
  • Consumption index
  • Average weight of animals
  • Mortality rate of the batch

These graphs show only the data entered for the selected flock. You can compare data between flocks using the ‘Analysis’ module, which is available in the main menu.

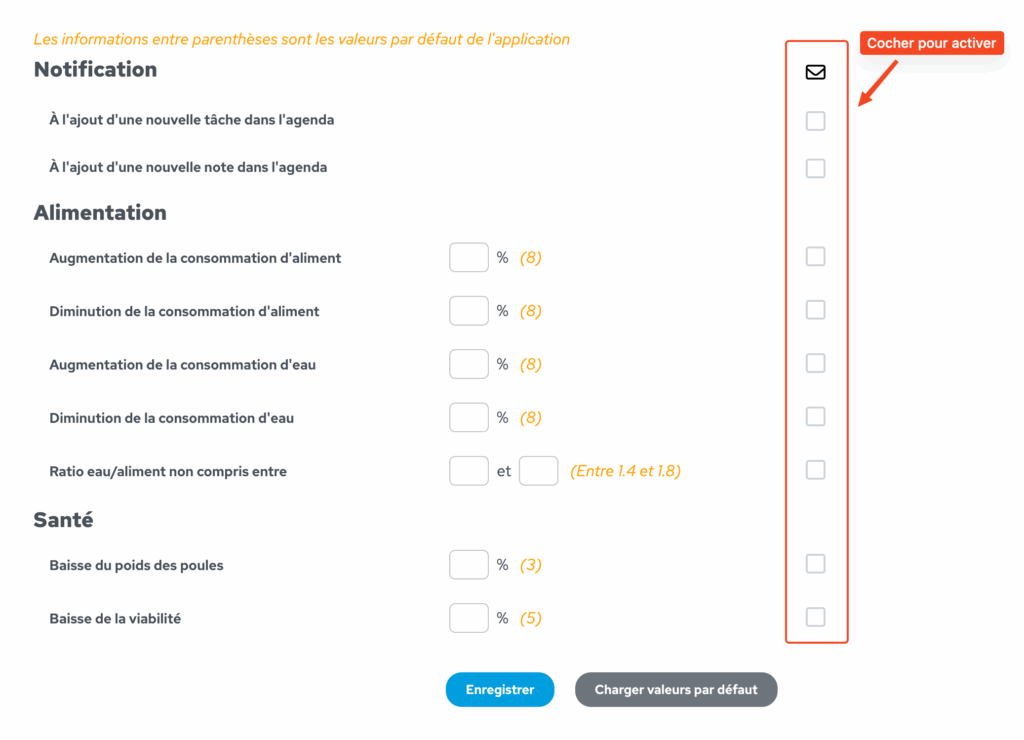
You can set up alerts to be notified when certain metrics reach a predefined value. Food intake, water intake, weight, viability… Here’s how to set them up.

In the app, click on the arrow next to the profile name in the top right-hand corner, then click on ‘Alert management’. Select the flcoks for which you wish to set up new alerts or edit existing ones.

Tick the boxes in the right-hand column to enable the desired alerts. By default, the alerts are set to the values shown in orange. E.g.: If the relevant box is ticked, the farmer receives an alert as soon as feed consumption increases by 8% compared with the last entry. You can customise this figure by entering the value of your choice in the % box.

Alerts configured in this way trigger the creation of a notification, the sending of an email and the creation of an event in the batch’s calendar.

Select the required flock, then access the calendar from the flock’s horizontal menu by clicking on ‘Calendar’.

To create a task, click on ‘Add an event’ then ‘Event type’: Task.

Fill in the description fields. Confirm.

The task appears in the calendar and is visible to everyone who has access to this flock.

To record a process in the calendar, select the relevant flock, then access the calendar from the flock’s horizontal menu.

Click on “Add an event” then “Event type”: Treatment.

Fill in the descriptive fields. Confirm. 

The treatment appears in the calendar and is visible to everyone with access to this flock. The “Show on graphs” option displays the date the treatment was administered on the graphs in the Statistics menu (weight, mortality, etc.) to facilitate data analysis.