Managing your livestock farm

Manage and analyse all the flocks on the farm.

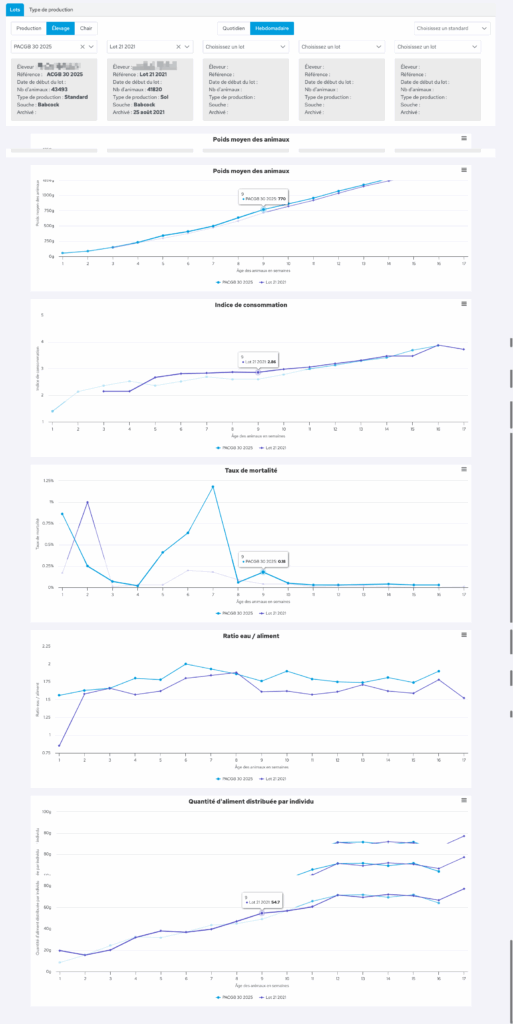
This feature allows you to compare flocks from the same farm with one another and against the breed standards provided by the breeding companies. You can also compare them with previous batches archived in Aniprev.

In the vertical menu, click on ‘Analysis’ and then on the ‘Flocks’ tab. Choose a production type: production, rearing or meat. Select between one and five flocks to compare. Select the strain standard if you wish to display it. The elements compared are average weight, feed conversion ratio, mortality rate, water-to-feed ratio and the amount of feed distributed per individual.
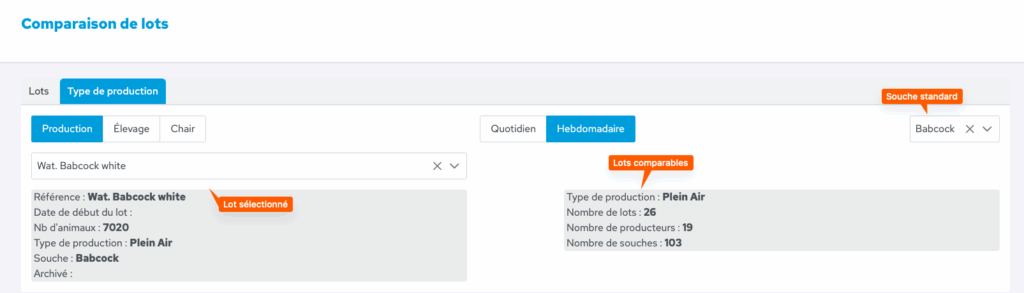
This feature allows you to compare a batch with the average data from batches of the same strain from breeders who belong to your organisation. It is also possible to display the standard curve for the strain, as provided by the breeding companies, on the graphs. 

In the vertical menu, click on ‘Analysis’ and then on the ‘Production type’ tab. Choose a production type: production, rearing or meat. Select one of the flocks corresponding to this type.  

In the example below, the “Wat. Babcock White” flock will be compared with 26 free-range flocks, from 19 producers and comprising 103 strains. We have chosen to display weekly data (rather than daily) and the standard curve for the Babcock strain.

The parameters compared are the laying rate, the average weight of the birds, the mortality rate, the water-to-feed ratio, the amount of feed distributed per bird, the average weight of the eggs, the percentage of rejected eggs, and the feed conversion ratio per egg. The application provides a graph for each of these criteria.

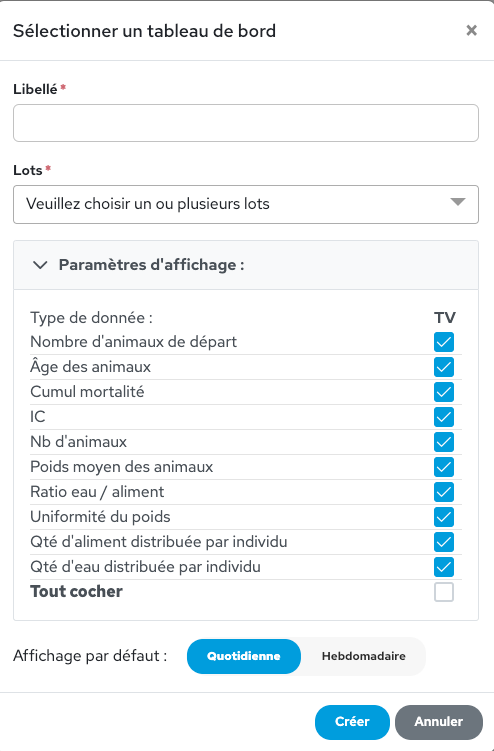
The dashboard allows you to save a customised view of the data so that you can see all the information you need at a glance and in one place. This saves you from having to create a new query every time. You can create as many dashboards as you need, for example: one to display production batches, another for rearing batches, and one to compare batches from two different years…  

In the vertical menu on the left, click on ‘Dashboard’ and then on the cog icon. 
To create a new dashboard, click on the ‘+’ icon in the top right-hand corner. Choose a name for this new dashboard and select the batch(es) from which this dashboard should retrieve information. Then choose the data to display – daily or weekly – and click “Create”. 

The multi-flocks, or global, calendar can be accessed from the vertical menu on the left. It allows you to view the calendars for all the flocks you are tracking on a single calendar. However, to create a task or an event, you need to go to the calendar for the relevant flock. 

In Aniprev, a protocol is a sequence of actions to be performed in a specific order. Protocols can have multiple purposes: medical treatment, cleaning a building, settling in animals, and so on. After creating the protocol, the user selects the batch or batches to which they want to apply it. For each action in the protocol, a task is created in the schedule for the relevant flock.  

Example of how to schedule sampling for a flock of laying hens: 

  • Select “Protocols” from the vertical menu on the left.
  • Click the “+” icon in the upper-right corner to create a new protocol.
  • Description: Choose a name for this protocol. Example: “Laying Hen Sampling Schedule.”
  • Click the “+” button on the row of the newly created protocol to add an event: 
    • Description: “Salmo DSV, MG MS, pull, IDG samples – 20s”
    • Number of days since the start of the protocol: 0
    • Type: Select “processing”
    • User: Select “technician and veterinarian”
    • Click “Create.” 

Create an event similar to Day 28, Day 56, Day 84, Day 112… 
Once the protocol has been created, you must assign it to the desired batches by clicking the ∞ button: 
Image